The most demanding simulator (in terms of balance and scalability) let you test your system and see how performs under load in different types of session. It is a great way to check if something fails on your hardware configuration and point in the right direction.This is an auto reminder and an easy way to recover needed information which is somehow hidden in the iRacing support page. You can see the original content clicking here. You can join iRacing clicking here
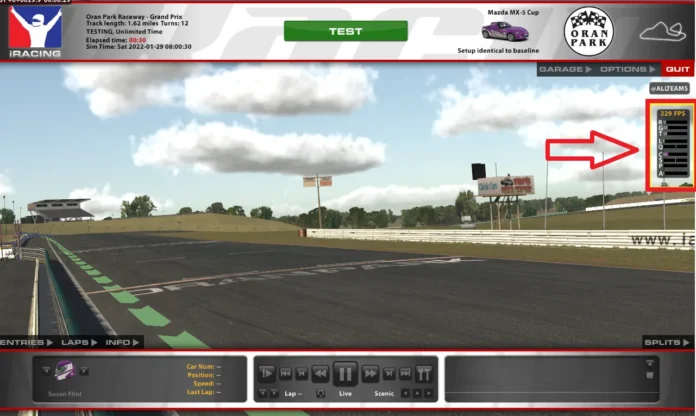
Pressing “F” on your keyboard will enable the framerate meter, which shows a number of performance statistics for the sim.
The framerate meter can be configured to show information on a wide range of systems, and these can be enabled individually on the Options tab of the sim options menu. The Graphical setting will show a bar for that setting while Numeric will show a number value.
Display Explanations
Each row on the framerate meter shows a single letter, and then either a horizontal bar or a text value. The meaning of each letter is listed in a tooltip that can be seen when mousing over the value. Solutions are also listed if you are seeing unacceptable values for a given label.
| Label | Meaning | Solutions |
|---|---|---|
R | The time it takes for the renderer to process a frame. A second bar shows the 15-second average in purple. A full bar is 1 second. In text mode the value is displayed in milliseconds. | Lowering or disabling settings that rely on the CPU will decrease the value. Shadows, cubemaps, HDR, and object detail are good settings to adjust for this. |
G | The time it takes for the graphics card to draw a frame. The grey value represents a short term average, while the purple bar is a longer term average. A full bar is 1 second. In text mode the value is displayed in milliseconds. | Lowering or disabling settings that rely on the GPU will decrease the value. HDR, Antialiasing (AA), mirrors, sharpening, heat haze, and distortion are good settings to adjust for this. |
L | Latency is the time it takes for a message to travel between your PC and the iRacing server you are connected to. The bar will turn yellow and then red as the latency increases. A latency in the red area for too long may lead to being dropped by the race server. A full bar is 1 second. In text mode the value is displayed in milliseconds. | Latency is most often impacted by things outside of the iRacing simulator. Check for other processes using bandwidth in the background or on other systems in your network. Restart both your Modem and Router. If none of this works there may be an issue with your ISP or another place in the network path. However, if you see your C bar is also red it could cause increased latency. Fixing this should be done by fixing the C bar (see below). |
Q | Network quality captures the number of dropped packets in both the receive and transmission sides. A bar on the left indicates a loss of packets coming from the server to your PC. A bar on the right indicates the server is not receiving packets from your PC. The bar will turn yellow and then red as the network quality decreases. A value in the red for too long may lead to being dropped by the race server. A full bar in either direction indicates 50% packet loss. In text mode the value shows the percentage of packets being received by the race server and the local machine. | Network quality is most often impacted by things outside of the iRacing simulator. Check for other processes using bandwidth in the background or on other systems in your network. Restart both your Modem and Router. If none of this works there may be an issue with your ISP or another place in the network path. However, if you see your C bar is also red it could cause increased packet loss (and therefor degraded network quality). Fixing this should be done by fixing the C bar (see below). |
C | The amount of time spent in the physics thread. This thread needs to be run 60 times a second to keep the user up-to-date with what is happening in the sim. If the user is not able to keep up with the physics thread the S bar will start to rise. The bar will turn yellow and then red as the time spent in the physics thread reaches values near the limit. As with the “Q” bar, a green bar is good, yellow or orange means less than ideal synchronization with the iRacing service, and it will turn red if your synchronization is dropping below an acceptable level. A full bar is equal to one cycle at exactly 60Hz, or roughly 0.016 seconds. In text mode the value is displayed in milliseconds. | The physics thread runs on the CPU, so anything recommended for decreasing the R value applies here as well. Additionally, you may need to lower the number of cars you are receiving, using the Max Cars setting in the in-sim Options. Lowering this will reduce the number of cars for which you are doing physics work. |
S | Skew is the amount of delay currently in the physics system. If a user is not able to maintain a 60Hz rate they will fall behind one tick at a time. This offset value is Skew. If this bar spikes occasionally it may be due to high load momentarily, or various background processes on the PC. If it continuously rises the PC may be incapable of running the sim with the current settings. A full bar is 1 second. In text mode the value is displayed in seconds. | Skew is caused by the C value reaching unacceptably high values, so cannot be reduced directly. |
P | Page Faults occur when Windows needs to move data from memory to the hard drive, or vice versa. It is normal to see this happen occasionally, but if it is happening continuously there may be an issue. A full bar is 30 page faults per second. In text mode the value is displayed in page faults per second. | If you are seeing a solid yellow or red bar the easiest solution is to lower the GPU Video Memory slider (move it to the left) in the advanced graphics options to make the simulation use less RAM. If this doesn’t work you may benefit by adding RAM to your PC. Other processes and services running on your PC also use RAM, so it can help to reboot your PC and close down as many applications as possible before running the simulation – to free up as much physical memory as possible. If you are seeing a solid gray bar in the “P” meter, this means your system is incurring a lot of interrupts (or soft page faults) to manage virtual memory. You may benefit from reducing your GPU memory slider and restarting the sim. If this doesn’t help try reducing your system working set memory slider. Soft page faults like these may not be that bad, but if you can get rid of them, it will surely help performance. |
A | The percentage of the available CPU time being used to process sounds for audio playback. A second bar shows the 15-second average in purple. A full bar is 100%, and would mean no CPU time was left for the simulation. | The audio bar should never reach peak values before other bars. If it does it most likely indicates an issue with an audio device. Try deselecting, disabling, or unplugging audio devices and see if any resolve the issue. If so, reinstall drivers for that device. |
X | The percentage of the available CPU time being used to process sounds for the XAudio system. A second bar shows the 15-second average in purple. A full bar is 100%, and would mean no CPU time was left for the simulation. | The XAudio bar should never reach peak values before other bars. If it does it most likely indicates an issue with an audio device. Try deselecting, disabling, or unplugging audio devices and see if any resolve the issue. If so, reinstall drivers for that device. |
T | The T-Meter measures the total frame time from when the renderer started generating the frame until the GPU completed drawing it. It is not exactly the same as the R + G timer, because the CPU queues frames to the GPU and they can pile up, also the GPU is running in parallel with the CPU. | Since this meter is similar to the sum of the R and G meters, anything that is done to reduce those values will also reduce the T value. |
This website uses affiliate links which may earn a commission at no additional cost to you.


