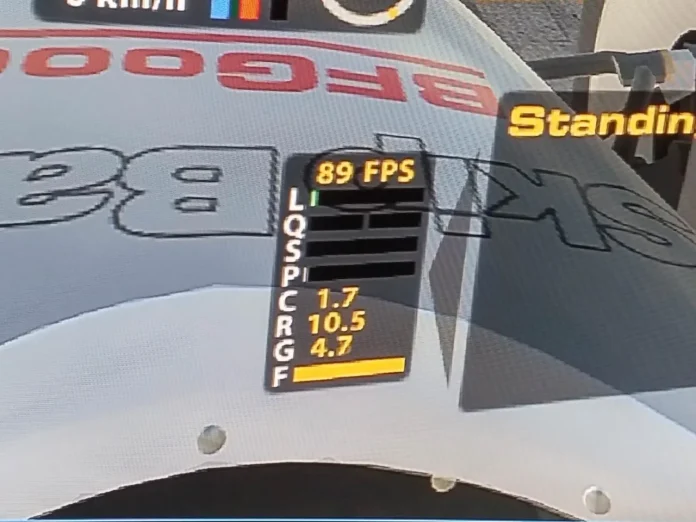
Sometimes with the VR (Oculus, Vive, etc.) and the new CPU’s we are in doubt about what device is stopping us from reach the optimal performance. iRacing has a simple visual tool to help with these findings. Here Clive Norton explain how to do it and read them. Also, you can check it online going here: http://thebottlenecker.com/
You can monitor this in-game by adding CRG meters to the FPS blackbox.
edit \documents\app.ini
[XXX Dev Use Only]
CPUMeter=1 ; Include the sim-thread's CPU usage in the L/Q/S meter group?
CPUMeterAsText=1 ; Show CPU meter as ms in text?
C is the CPU doing the physics thread at 60Hz, so needs to be under 16.7ms, and under 14ms in practice. Slower CPU’s might need to reduce the number of visible cars or get a CPU with a faster single core speed. You’ll be fine.
R is the CPU doing the render thread. R is affected by scene complexity, objects, mirrors, shadows, dynamic shadows, dynamic track, grandstands, car detail, event, objects, crowd, car complexity, etc. If this is your bottleneck, reduce these or get a CPU with a faster single core speed. If not, increase them.
G is the GPU doing the graphics thread. G is affected by resolution, AA, AF, AATransparency, filtering, sharpening, FXAA, heat haze, and any other pixelly things I’ve forgotten. If this is your bottleneck, reduce these or get a faster GPU. If not, increase them.
Whichever of R or G is highest is your bottleneck.
Theoretical frame rate should be 1000/R or 1000/G, whichever is worse, but in practice is lower than that.
This website uses affiliate links which may earn a commission at no additional cost to you.


I don’t think that this is accurate when you are in VSync (e.g. using VR). When I log in fpsVR the render time is actually C + G, then CPU and GPU both are idle until R. Regardless of fps settings R will sit just under the required frame time for VSync. It will be lower at high frame rates and higher at low frame rates. fpsVR logging or something similar will be self explanatory.